OPNsense dashboard widget
See which devices are using your bandwidth, live.
Top Devices ranks every device on your network by download and upload, second by second or over any date range. It reads your firewall’s own data, so there’s no collector to set up.
Install · run once on the firewall as root
fetch -qo /tmp/td.tgz https://codeload.github.com/nycoagung/opnsense-plugin-topdevices/tar.gz/refs/heads/main && rm -rf /tmp/tdx && mkdir -p /tmp/tdx && tar -xzf /tmp/td.tgz -C /tmp/tdx && sh /tmp/tdx/opnsense-plugin-topdevices-main/install.sh- Free
- MIT licence
- Tested on OPNsense 26.7
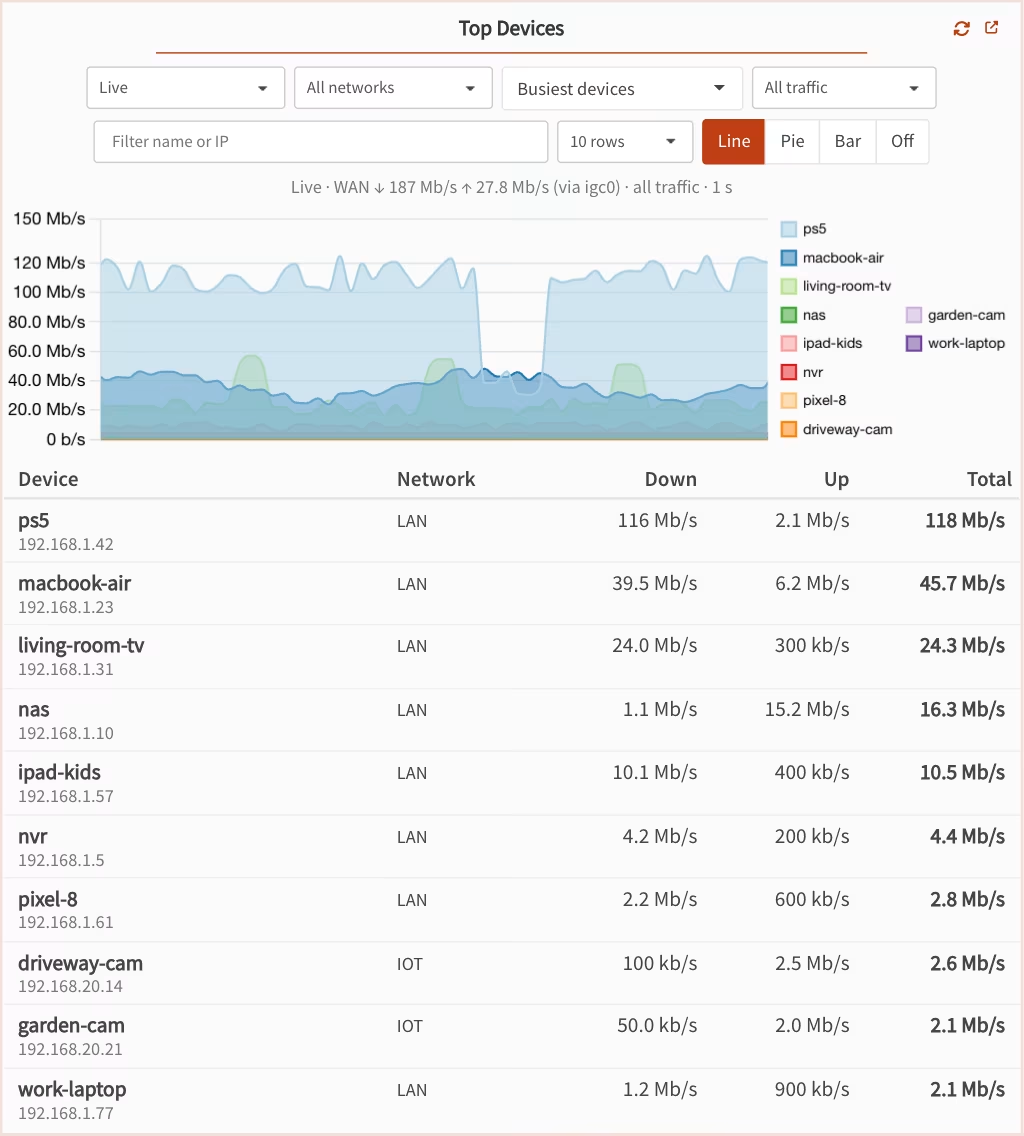
- Every second Live rates straight from the firewall’s connection table.
- 98.7–102.7% of WAN download accounted for, checked against the firewall’s own counters.
- No extra collector Uses NetFlow and Insight, already built into OPNsense.
- Under 2% of one core And it slows itself down before it would use 10%.
What it shows
Your network, device by device
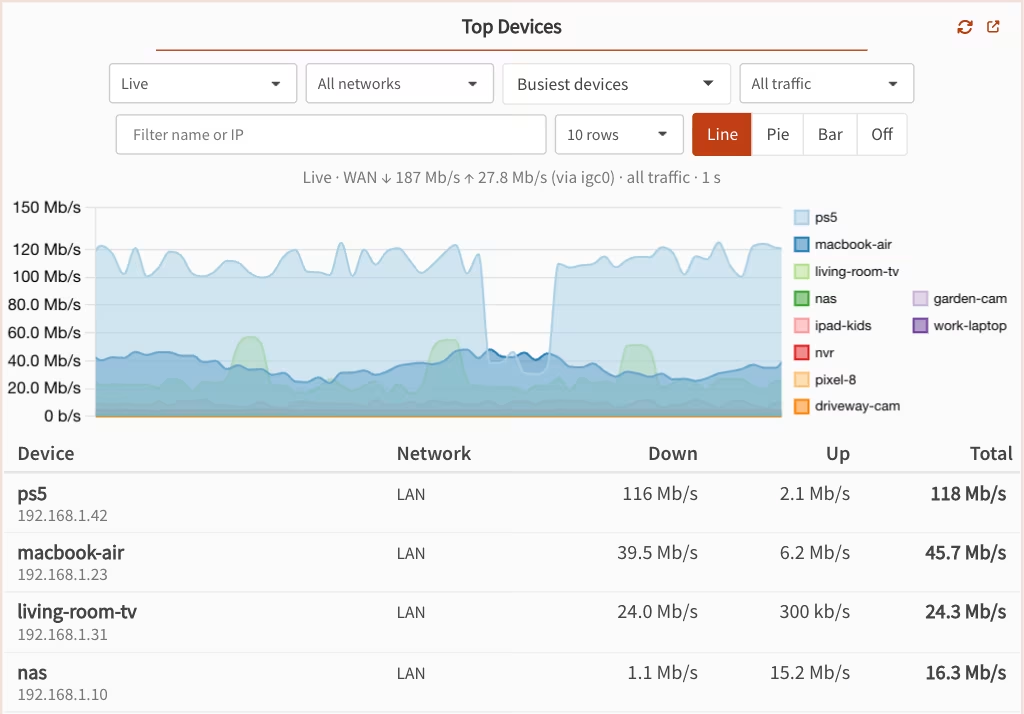
Live
Every device’s traffic, second by second
Pick Live and each device’s download and upload refresh every second, with a line graph of the last minute. The figures come from the firewall’s connection table, so even a WireGuard client shows up under its tunnel address.
- Updates every 1, 2 or 5 seconds
- Pin the devices you care about
- Runs only while the dashboard is open
Any date range
Yesterday, exact to the second
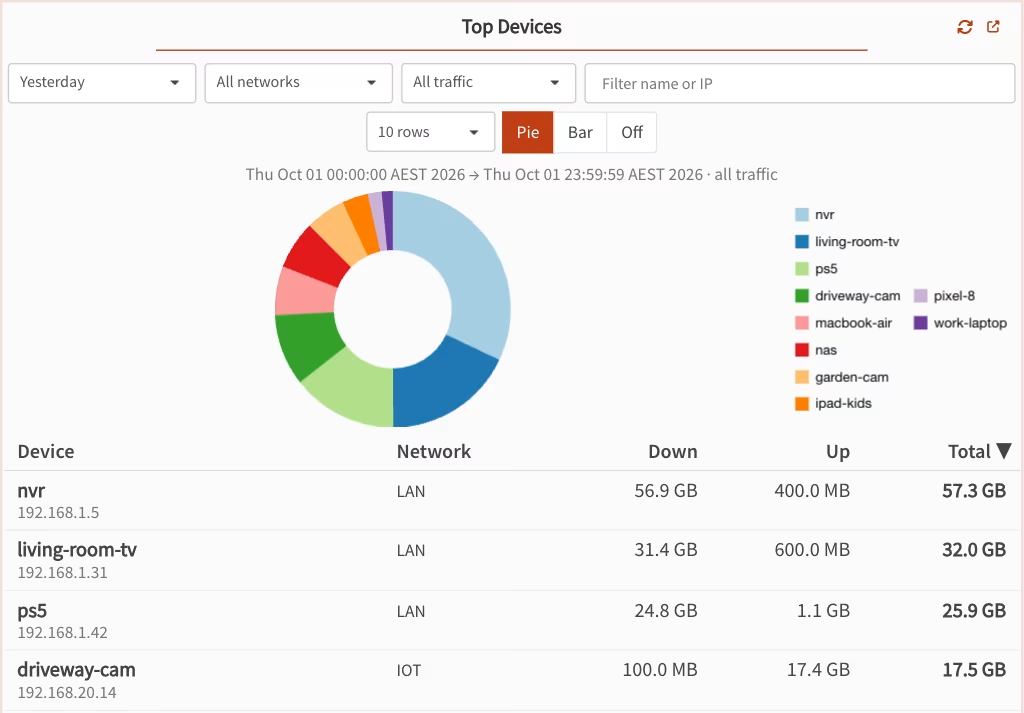
Choose the last hour, today, yesterday, the last 7 days or your own range. Anything that starts in the last 50 hours is read from NetFlow’s raw flow log, which the plugin keeps for two days, so the figures are exact to the second. Older ranges use NetFlow’s own records, kept for up to a year.
Every range shows its exact span, and midnight is the firewall’s midnight, wherever your browser is.
Download, upload, internet
See what actually reaches the internet
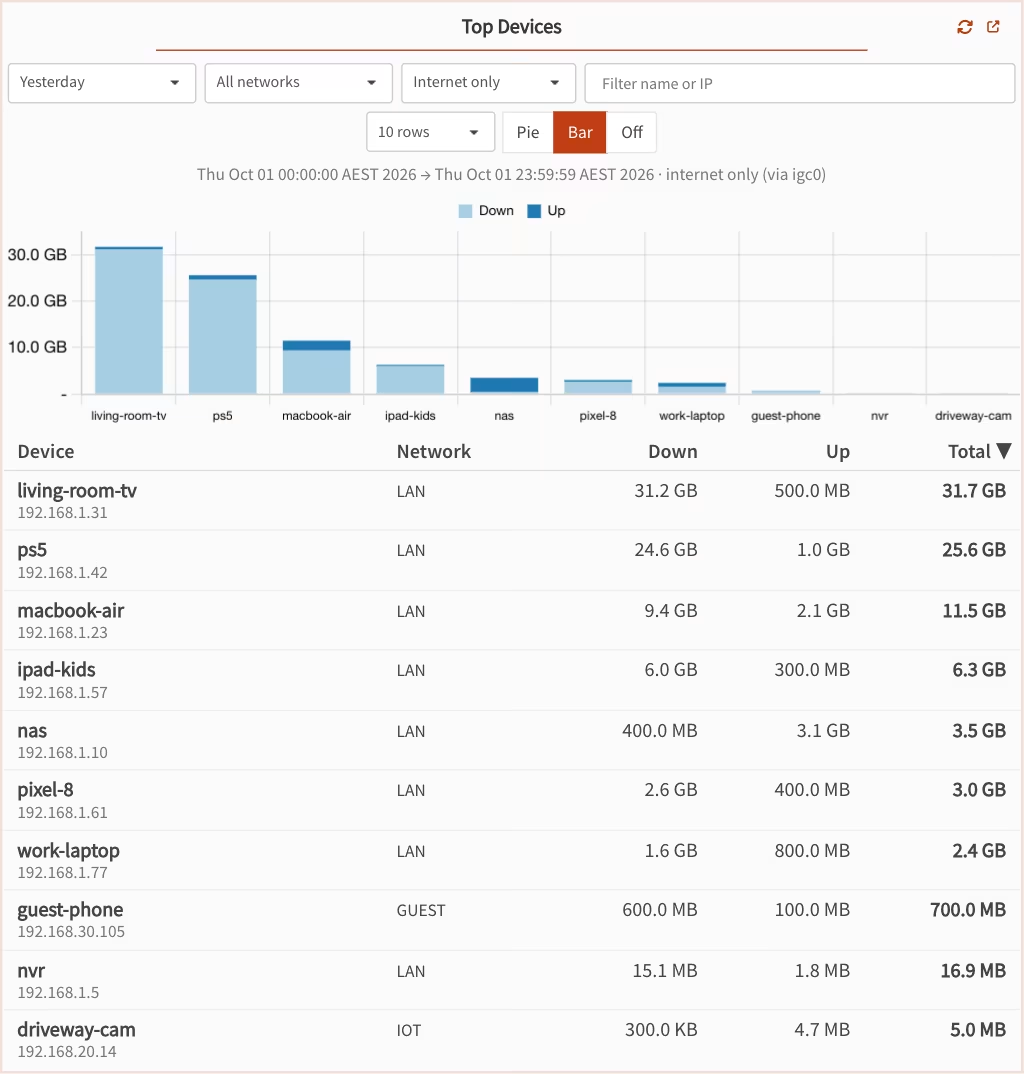
Every device is split into download and upload. Switch from All traffic to Internet only and local traffic drops out: on the test network, a video recorder showing 57.3 GB of traffic had used 16.9 MB of internet. The rest was camera streams that never left the house.
Drill down
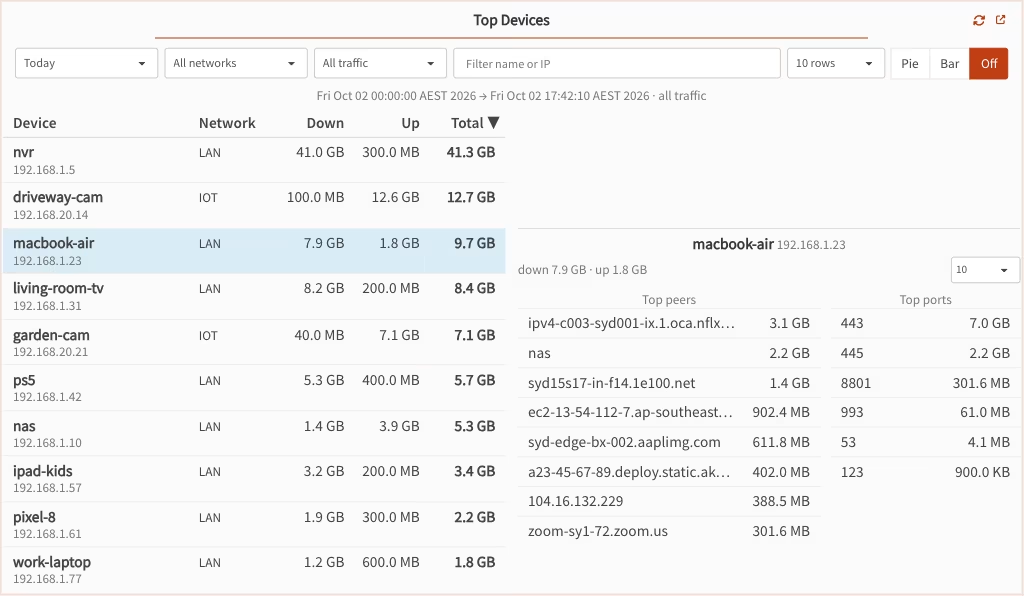
Click a device to see where its traffic goes
A panel opens beside the row with the device’s top peers and ports, and its figures agree with the table to within 0.1%. Peer names come from reverse DNS, so expect the hosting provider, such as a CDN or cloud host, rather than the website itself.
Also in the widget
The details you’d expect
Pie, bar or line
A pie of totals or a stacked bar of download against upload. Live adds the line graph.
Filter and sort
Narrow the list to one network (LAN, IoT, Guest) or to a name or IP. In the date ranges, sort any column; Live keeps the busiest device on top.
10 to 100 rows
Choose how many devices to list, and drag the widget as tall as all of them.
Names you recognise
Hostnames come from Dnsmasq’s DHCP leases and host records, networks from your interfaces. Nothing is hardcoded.
Remembers your view
Range, scope, filters and chart survive refreshes and reloads.
Works behind an ISP router
The WAN is found by its default route as well as its address, so double NAT works for Live and for ranges in the last 50 hours.
Measured, not assumed
Numbers that add up to your WAN
Checked against the firewall’s own interface counters on a real network. In Live, every update repeats the check: if the devices’ total drifts more than 10% from the WAN counters, the widget says so instead of showing quietly wrong numbers.
- 98.7–102.7% of WAN download accounted for by Top Devices, over 380 one-minute windows
- 32–68% of the same load shown by OPNsense’s built-in Top talkers
Install
Running in three steps
Turn on NetFlow
Under Reporting → NetFlow, choose your interfaces and tick Capture local. The date ranges need it; Live works without it.
Run one command
The command below, as root on the firewall, over SSH or the console. It fetches the plugin from GitHub and installs it.
Add the widget
Hard-refresh the dashboard (Ctrl+Shift+R, or Cmd+Shift+R on a Mac) and add Top Devices from the widget picker.
Shell · as root on the firewall
fetch -qo /tmp/td.tgz https://codeload.github.com/nycoagung/opnsense-plugin-topdevices/tar.gz/refs/heads/main && rm -rf /tmp/tdx && mkdir -p /tmp/tdx && tar -xzf /tmp/td.tgz -C /tmp/tdx && sh /tmp/tdx/opnsense-plugin-topdevices-main/install.sh- Keeps itself installed: a weekly job puts the files back after a firmware update.
- Updates the same way:
configctl topdevices install - Removes cleanly:
configctl topdevices uninstall(adddry-runto preview) - Prefer a package? Build os-topdevices from the plugins tree, as the README explains.
Good to know
What it can’t see
Top Devices shows what the firewall can measure. These fall outside it.
- Traffic inside one network Two devices on the same network talk directly, so that traffic never reaches the firewall.
- Websites by name NetFlow records addresses and ports, not domains. Seeing sites takes deep packet inspection, such as Zenarmor.
- IPv6 traffic It isn’t credited to devices. Live counts IPv6 connections and says how many in its caption.
- WireGuard under Internet only Tunnel clients reach the WAN already translated, so they show in Live and All traffic, not in Internet only.
- Very short connections in Live A connection that opens and closes between two samples is never seen. The date ranges, from NetFlow, still count it.
- Untested setups Multiple WANs and accounts other than root haven’t been verified yet. Other users need the Dashboard: Top Devices privilege.
FAQ
Questions, answered
No. Live reads the firewall’s own connection table, and the date ranges use NetFlow and Insight, which OPNsense already has. There’s nothing else to install or run.
It’s built and tested on OPNsense 26.7. Device names come from Dnsmasq’s DHCP leases and host records; with another DHCP server, devices are listed by IP address.
On the test network, the devices Top Devices named carried 98.7–102.7% of WAN download and 98.5–101.8% of upload, measured against the kernel’s own counters over 380 one-minute windows.
Live samples only while a dashboard shows it: a median 24 ms of CPU per second on the test firewall, about 1.6% of one core, and it slows itself down before using 10%. A date range takes about a second to read when the widget refreshes.
By the time their traffic reaches the WAN, their address has already been translated, so NetFlow has nothing to credit them with. Live keeps the address from before translation, so they appear there.
No. NetFlow has no domain names, and reverse DNS names the host, often a CDN or cloud provider, rather than the site. For that you need deep packet inspection, such as Zenarmor or Suricata.
Yes. The WAN is found by its default route as well as its address, so a WAN with a private address works for Live and for ranges that start in the last 50 hours. Older ranges still recognise the WAN by a public address.
It can, because the files don’t belong to a package. The installer adds a weekly job under System → Settings → Cron that puts them back, and you can run configctl topdevices install at any time.
Run configctl topdevices uninstall as root. It removes everything the installer added, including the weekly job, and touches nothing of OPNsense’s own. Add dry-run to see what it would remove first.
Yes. It’s free and open source under the MIT licence, and the code is on GitHub.
Get Top Devices
Put your network’s traffic on the dashboard
One command as root, then add Top Devices from the widget picker.
Install · run once on the firewall as root
fetch -qo /tmp/td.tgz https://codeload.github.com/nycoagung/opnsense-plugin-topdevices/tar.gz/refs/heads/main && rm -rf /tmp/tdx && mkdir -p /tmp/tdx && tar -xzf /tmp/td.tgz -C /tmp/tdx && sh /tmp/tdx/opnsense-plugin-topdevices-main/install.shQuestions or a bug? Open an issue on GitHub.
Also for OPNsense: Parental Control switches a device’s internet off on a schedule.
- Free
- MIT licence
- Tested on OPNsense 26.7
- No extra collector